Sylvia Broadbent

Sylvia Broadbent B

Data Analyst

About me

After a career as a building surveyor, I am now a Data Analyst with a Certificate from the University of Western Australia. The top three skills I learned are Python, SQL and JavaScript with many others. I love organising, and data analytics even takes that a step further by allowing me to also suggest and implement improvements.

While running my own business, I have proven my skills as a project manager with a critical mind focussed on problem solving to achieve the best outcome for my clients. I am reputable and well respected amongst my peers due to my honesty and integrity. Now that I have gained programming skills in analytics, I am in a unique position to understand what is involved in running a business and can combine my skills to extract the right data and advise you what changes can positively impact your business.

Technical skills

  • Programming languages: VBA, Python, SQL, HTML, JavaScript
  • Databases: PostgreSQL, MongoDB
  • Applications: Github, Command Line, Flask, Beautiful Soup
  • Tools: Excel, Jupyter, Pandas, Matplotlib, dbAdmin, ETL, API, D3, Plotly, Leaflet, Tableau

Projects


Machine learning

  • Project using a survey providing personal predictions to get the conversation going.
  • Machine learning models: Logistic Regression, Random Forest and Sequential.
  • Completed using Python, Javascript, Plotly and Pandas.
  • Deployed using Flask via Heroku.

Visit the website


Tableau

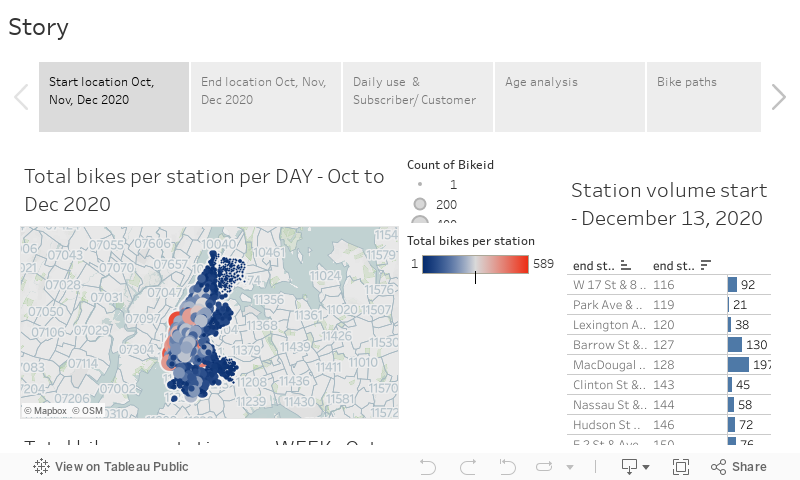
Analysis and visualisation of Citybike New York. I chose the period October to December 2020. The data was cleaned using Python with Pandas by removing anomalies to get a better representation of the use of the Citybikes.

This is a fully interactive embedded window, but you are also free to visit the workbook on the Tableau public site.

Visit the workbook Download the report


Data Visualisation Project

  • Project about raising awareness of the UV Index values and the importance of protection.
  • Completed as part of a group of 4. I was responsible for the visualization and presentation, non-geo graphs including the extraction of the information from the database and through an API.
  • Completed using Javascript including D3 and Plotly, HTML including bootstrap, CSS.

Check out the project


Geo-mapping with Leaflet

  • Project using Leaflet to visualise earthquakes and tectonic plates. The tectonic plate information is a given GeoJson file.
  • The earthquake data is collected from US Geological Survey (USGS) and is updated dynamically when opening the webpage.
  • Creating a map with the circle diameter and colour showing the magnitude of the earthquakes by size.
  • The map has several map options, a legend and a pop-up menu appears with related data when clicking on a circle.

Visit the website


D3 Challenge

  • Project using D3 to visualise the health risks facing a particular demographics using information from the U.S. Census Bureau and the Behavioral Risk Factor Surveillance System.
  • Creating a dynamic visualisation using a scatter plot.
  • The information changes depending on the x and y values that are chosen. The pop-up information changes accordingly.

Visit the website


Plotly dashboard

  • Project with a given dataset to create a dashboard visualising operational taxonomic units (OTU's) in subjects belly buttons.
  • The dashboard is created using HTML, CSS, Bootstrap, Plotly, D3 and jQuery.
  • The dashboard includes a demographic card, horizontal bar chart, bubble chart and gauge.

Visit the website


JavaScript & D3 Challenge

  • Project using a given dataset with UFO sightings in 2010.
  • Created a website showing the information in a table format.
  • Provided a filter search with multiple filter options using D3 and jQuery.

Visit the website


Extract, Transform and Load (ETL)

  • Project to find different datasets available online and combine them into a database.
  • Reading the data of LEGO sets using Python with Pandas.
  • Creating a report including diagrams to visualise the information using Pandas and Matplotlib.
  • Creating a schema using an Entity Relational Diagram (ERD).
  • Entering the information into a new PostgreSQL database using PGAdmin.

Download the report


Web Scraping Challenge

  • Using Python with Pandas and Splinter to collect information from several websites.
  • Create a scrape function that collects the information as a Python dictionary in a MongoDB database.
  • Create a website that displays the collected information.
  • Create a script that executes on the click of a button that refreshes the information.

Check out the project


Web Design Challenge

  • Building a website using a previous analysis.
  • Completed using HTML, CSS and Bootstrap.

Visit the website


Python Data Visualisation

  • Project about the impact of the Covid-19 crisis on the residential construction and real estate market.
  • Completed as part of a group of 4. I was responsible for the analysis of the issued permits, construction value and correlation.
  • Completed using Python, Pandas, Matplotlib and data analytics to find the answer to our hypothesis, that Covid-19 does not affect all parts of the market.

Download the report


Education

  • Certificate,
    Data Analytics & Visualisation

    University of Western Australia
  • Graduate Certificate,
    Building and Planning (Building Surveying)

    University of South Australia
  • Bachelor Degree (B),
    Architectural and Construction Engineering

    University of The Hague (NL)

Languages

  • English
  • Dutch

Citizenship

  • Australian
  • Dutch